• Mule4 Execution Engine
In Mule4 the runtime engine is designed for nonblocking and asynchronous execution. Mule4 runtime is a “Reactive” execution engine.
This new runtime manage/tune different workload automatically. In means Mule Even processor itself indicate what type of operation they want follow. The operation could be CPU-light, CPU-intensive or IO-intensive.

  • Mule Event Processing Types
As we all know Mule 4 runtime is based on event. And based on type of event below are the processors. They decide how a Mule component work or operate. That means, how speed a mule component will process, how many threads or which type of thread pull will allocate.
  • CPU-light :
    • This processor is for quick operation. The processing speed will be around 10 ms.
    • By default, this processor does perform only NON Blocking activities.
    • Logger, HTTP Requestor component. These type of tasks will not perform any Blocking activities.
    • While running any Mule4 application, we can identify these processors in console logger.
    • From console log we can find CPU_LIGHT and CPU_LIGHT_ASYNC string, which will tell us which component is running on CPU-light processing type.

  • CPU-intensive :
    • This type processor is not for quick operation. It takes more than 10 ms to perform any task/activity.
    • These tasks should not perform any I/O activity.
    • Transform Message component use this processor.
    • From Studio console log we can identify CPU_INTENSIVE string, which is give information which mule component use CPU-intensive processing type.

  • Blocking IO :
    • For any operation where Mule component has to wait for response or it blocks the thread, in those operations Blocking IO will use.
    • Database select operation or SFTP read operation.
    • BLOCKING or IO in console logs will indicate us that which Mule component is using Blocking IO processing type.

  • Centralized Pools
Based on Mule event processing type we have 3 thread pool in Mule 4 engine.
Now we can not manage or configure the thread pools in Application levels, Instead Mule 4 engine using the thread management internally.
All these 3 pool are centralized, which will manage at runtime level. If any configuration or changes required according to Application processing, we have to handle at runtime level by using JVM parameters inside the Mule runtime.
Below are the 3 centralized thread pool which are based on Mule event process :-
Mule Application will use threads from each pool based on event. In this thread process, a single flow can utilise multiple threads from different pool based on the usage of components.
  • CPU_LITE
  • This thread pool is the small pool in Mule 4 runtime engine. By default, It has only 2 threads for each available core.
    This pool perform the handshake between processors in a flow and handling only Non blocking I/O.
    Due to some bad code or code misusing CPU Light pools may get un-responsive or throughput will drop. WAITING or BLOCKED, these strings in console logs will help us to identify the issue easily.

  • CPU_INTENSIVE
  • This thread pool is also the small pool in Mule 4 runtime engine. By default, It has only 2 thread for each available core.
    But a queue is provided in this pool, which helps to process more tasks.
    This pool will use by Transform Message component, if we have complex logic or big lines of code in the transform logic, it may cause for thread blocking and which can leads for slowing of processing speed.

  • BLOCKING_IO
  • This is the bigger pool among all 3 pools. This is an elastic pool, means it can grow to max limit (limit will vary based on types of container/runtime system) based on the number of requests.
    For transaction scope or transactional flows, this pool will use. Because most transaction managers require all steps of the transaction to be performed in a single thread.
    Tasks running in this pool should spend most of their time in WAITING or BLOCKED states instead of performing CPU processing, so that they do not compete with the work of the other pools.

  • Custom Thread Pool
Apart from default THREE pools Mule 4 runtime use some additional pools for specific purposes :-
  • NIO Selector :- Based on requirement components use NON Blocking IO. Internally Java NIO Selector is being use most of the time by the connector or component.
  • Recurring Pools :- Some connector or component can create this type of custom pool for recurring tasks.
  • GRIZZLY
  • In Mule 4 runtime this one of the most custom thread pool being used HTTP components.
    This is a NIO Selector thread pool. Java “NIO” has the concept of selector thread.
    This pool is also configured at runtime level and shared by application deployed to that runtime.
    GRIZZLY is devided into TWO pools. One is GRIZZLY(Shared) and other is GRIZZLY(Dedicated). The Shared one will use by HTTP Listener and HTTP Requestor will use the dedicated one.

  • Thread Pool Configuration
The minimum size of thread pool will determine on CPU size, and that will decide once the runtime starts.
Here is the Mule 4 thread pool configuration, which will depend how we are configured our CPU and RAM size.
Name of Pool Minimum Size Maximum Size When the size created by runtime
CPU_LITE #cores 2 * #cores Mule Runtime startup
CPU_INTENSIVE #cores 2 * #cores Mule Runtime startup
BLOCKING_IO #cores #cores * mem-245760/5120 Mule Runtime startup
GRIZZLY (Shared) #cores #cores + 1 Deployment of first App using HTTP Listener
GRIZZLY (Dedicated) #cores #cores + 1 Deployment of each App using HTTP Requestor
  • Example of a Mule Container
For a Mule runtime sitting on a 2 core CPU with 1 Gig machine or container, the following table shows what the minimum and maximum values are for each thread pool.
Example Name of Pool Minimum Size Maximum Size
2 Core CPU with 1 GB RAM CPU_LITE 2 4
CPU_INTENSIVE 2 4
BLOCKING_IO 2 151
GRIZZLY 2 3
  • Knowledge before customise a Mule 4 container
Based on performance test of a Mule Application we may have to customize our Mule engine.
To take that decision we may have to know about each pool and their usability. Which will help to perform fine tune of a Mule server for better performance.
Mule 4 calculates the sizing of thread pools dynamically and automatically, and in most scenarios the defaults are optimal. Under most circumstances it not recommended from MuleSoft to change the default values. However, this exercise has discovered the default thread pools sizing are insufficient due to the high number of HTTP requests with a relatively low memory allocation and thread pool sizing.
Here are the pool and its event processors :
Pool Name Event Processors
CPU_LITE
  • All event processors scopes and routers except below list.
CPU_INTENSIVE
  • Tranform Message Component (DataWeave)
  • Scripting Modules
BLOCKING_IO
  • All blocking IO related modules (Database, SFTP)
  • Transactional Scope
GRIZZLY (Shared)
  • HTTP Listener
GRIZZLY (Dedicated)
  • HTTP Requester
The thread pool sizing is changed in the following file of the Mule runtime:
  • MULE_HOME/conf/scheduler-pools.conf
  • Mule 4 container Configuration
The thread pool is automatically configured by Mule at startup, applying formulas that consider available resources such as CPU and memory.
We can modify these global formulas by editing the MULE_HOME/conf/schedulers-pools.conf file in our local Mule instance.
In Mule we have TWO Scheduling Strategy
  •   UBER :- Unified scheduling strategy. (Default)
  •   DEDICATED :- Separated pools strategy. (Legacy)
  • UBER Scheduling Strategy
  • When the strategy is set to UBER, the following configuration applies:
    • org.mule.runtime.scheduler.uber.threadPool.coreSize=cores
    • org.mule.runtime.scheduler.uber.threadPool.maxSize=max(2, cores + mem - 245760) / 5120
    • org.mule.runtime.scheduler.uber.workQueue.size=0
    • org.mule.runtime.scheduler.uber.threadPool.threadKeepAlive=30000
  • DEDICATED Scheduling Strategy
  • When the strategy is set to DEDICATED, the parameters from the default UBER strategy are ignored.
    To enable this configuration, uncomment the following parameters in our schedulers-pools.conf file:
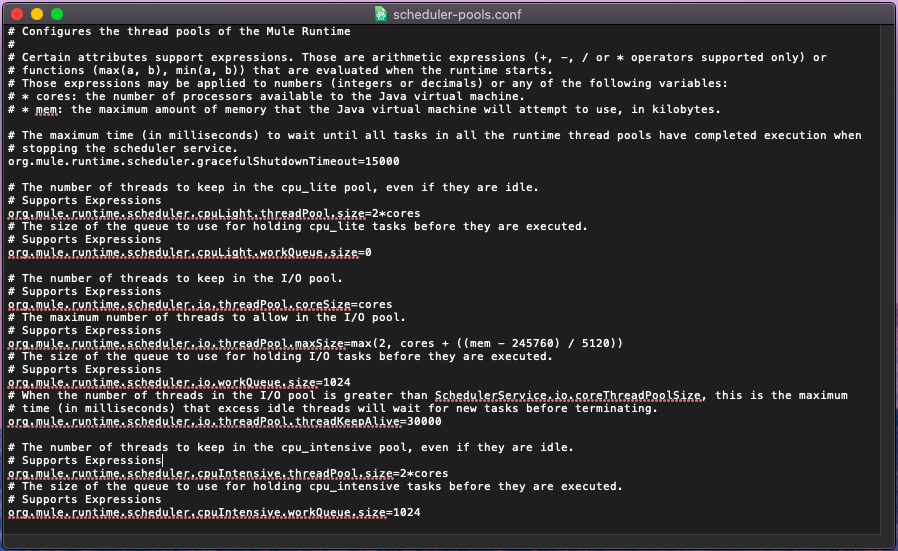
    • org.mule.runtime.scheduler.cpuLight.threadPool.size=2*cores
    • org.mule.runtime.scheduler.cpuLight.workQueue.size=0
    • org.mule.runtime.scheduler.io.threadPool.coreSize=cores
    • org.mule.runtime.scheduler.io.threadPool.maxSize=max(2, cores + mem - 245760) / 5120
    • org.mule.runtime.scheduler.io.workQueue.size=0
    • org.mule.runtime.scheduler.io.threadPool.threadKeepAlive=30000
    • org.mule.runtime.scheduler.cpuIntensive.threadPool.size=2*cores
    • org.mule.runtime.scheduler.cpuIntensive.workQueue.size=2*cores
Example schedulers-pools.conf file:
  • Use case for a Container Tuning
  • Issue
  • If we call a Java component from DW, that can lead us to performance issue.

  • Explanation
  • Dataweaves ideally execute in CPU_INTENSIVE threads since they should be processed in a non-blocking fashion. And if the DataWeave component calls Java code, which can lead CPU_INTENSIVE threads becoming blocked for significant periods of time, because the underlying Java code is executed synchronously leading to these thread blocks.

  • Solution 1
    • Change the Java invoked by Java component instead of DW.
    • Use Java module 1.2.5 or higher, which will support executing Java code in the BLOCKING_IO thread pool

  • Solution 2
    • Ideally DW component executes on CPU_INTENSIVE which has limited number of threads ( 2 thread per core).
    • We can utilise BLOCKING_IO pool instead to CPU_INTENSIVE, which will help us to use more number of threads.
    • Also, The BLOCKING_IO thread pool is better suited for blocking operations.
    • To perform this change, the following argument must be passed to the JVM: 
      Dmule.dwScript.processingType=BLOCKING

Comments